Bar Plot from Scientific Research

CC-BY
3
Views
0
Likes
Citation
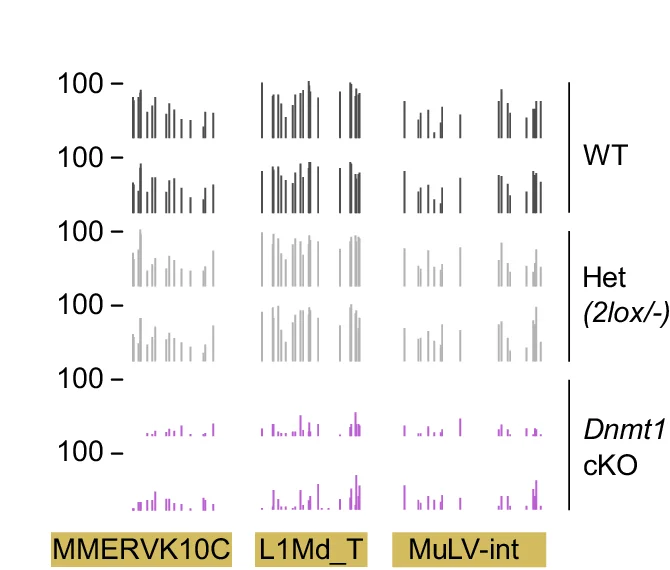
Examples of RRBS methylation profiles of retrotransposons in Dnmt1 cKO and control E13.5 PGCs (MMERVK10C chr18: 68,779,000 68,779,300; L1Md_T chr8: 91,423,000 91,423,500; MuLV-int chr8:123,427,900-123,428,800). Boxplots: center line indicates the median, red dot indicates the mean, box limits indicate upper and lower quartiles, whiskers extend to 1.5 interquartile range. Source data are provided as a Source Data file.
Related Plots
Browse by Category
Popular Collections
Related Tags
Discover More Scientific Plots
Browse thousands of high-quality scientific visualizations from open-access research