Bar Plot from Scientific Research

CC-BY
27
Views
0
Likes
Citation
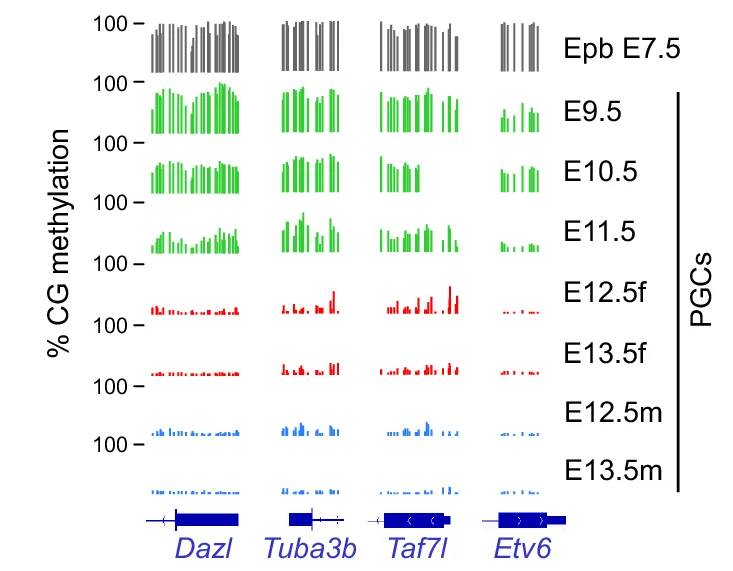
Boxplots of methylation levels of individual CpGs within residually methylated regions (RMRs) compared to the whole genome in female and male E13.5 PGCs ( n = 18,909,193 CpGs for the whole genome, n = 350,807 CpGs for RMRs).
Related Plots
Browse by Category
Popular Collections
Related Tags
Discover More Scientific Plots
Browse thousands of high-quality scientific visualizations from open-access research