Bar Plot from Scientific Research

CC-BY
63
Views
0
Likes
Citation
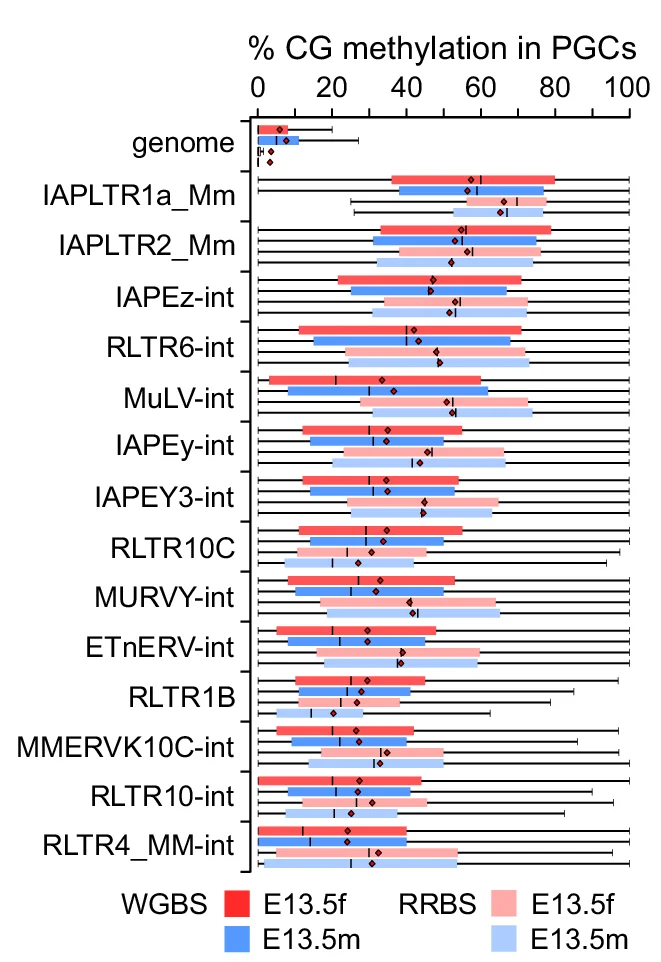
Methylation of the top methylated retrotransposon families compared to the whole genome in E13.5 PGCs. The boxplots show the distribution of methylation levels of individual CpGs overlapping with individual copies of each retrotransposon family in the WGBS or RRBS datasets. On average, 69% and 12% of the total number of individual genomic copies are covered in the WGBS and RRBS datasets, respectively. The numbers of CpGs and individual copies covered in each dataset are given in the source data file.
#Bar Plot#Error Bars#Clustered#Box Plot#Methylation#Retrotransposon families#Whole genome#PGCs#Boxplots#CpGs#WGBS#RRBS
Related Plots
Browse by Category
Popular Collections
Related Tags
Discover More Scientific Plots
Browse thousands of high-quality scientific visualizations from open-access research