Scatter Plot from Scientific Research

Citation
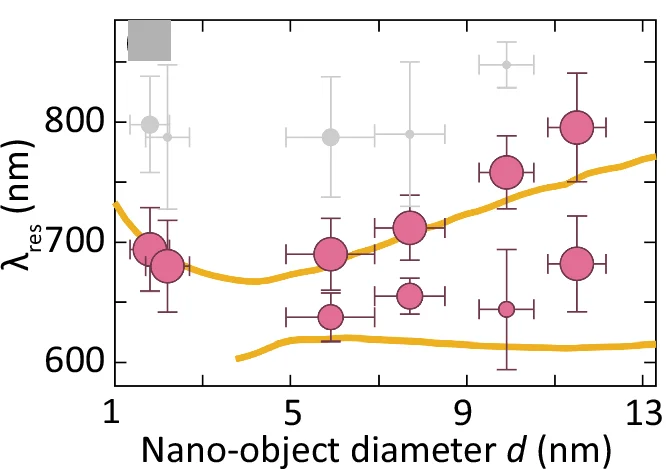
The resonance wavelength of Au nano-object with a diameter of 1.8 nm to 12 nm inside a nanocavity measured experimentally (pink circles) and simulation result from Fig. 1 c (yellow line). The size of the markers is determined by the relative frequency of occurrence in each histogram. The vertical error bar is determined from the standard deviation of the Gaussian distribution fit to the histograms, and the horizontal error bar is determined by the size variation of the nano-objects obtained from analyzing the SEM images of the nano-objects. The gray markers are the scattering peaks that have a much lower occurrence frequency, and they are attributed to the presence of more than one nano-object inside the gap.
Related Plots
Browse by Category
Popular Collections
Related Tags
Discover More Scientific Plots
Browse thousands of high-quality scientific visualizations from open-access research