Line Plot from Scientific Research

Citation
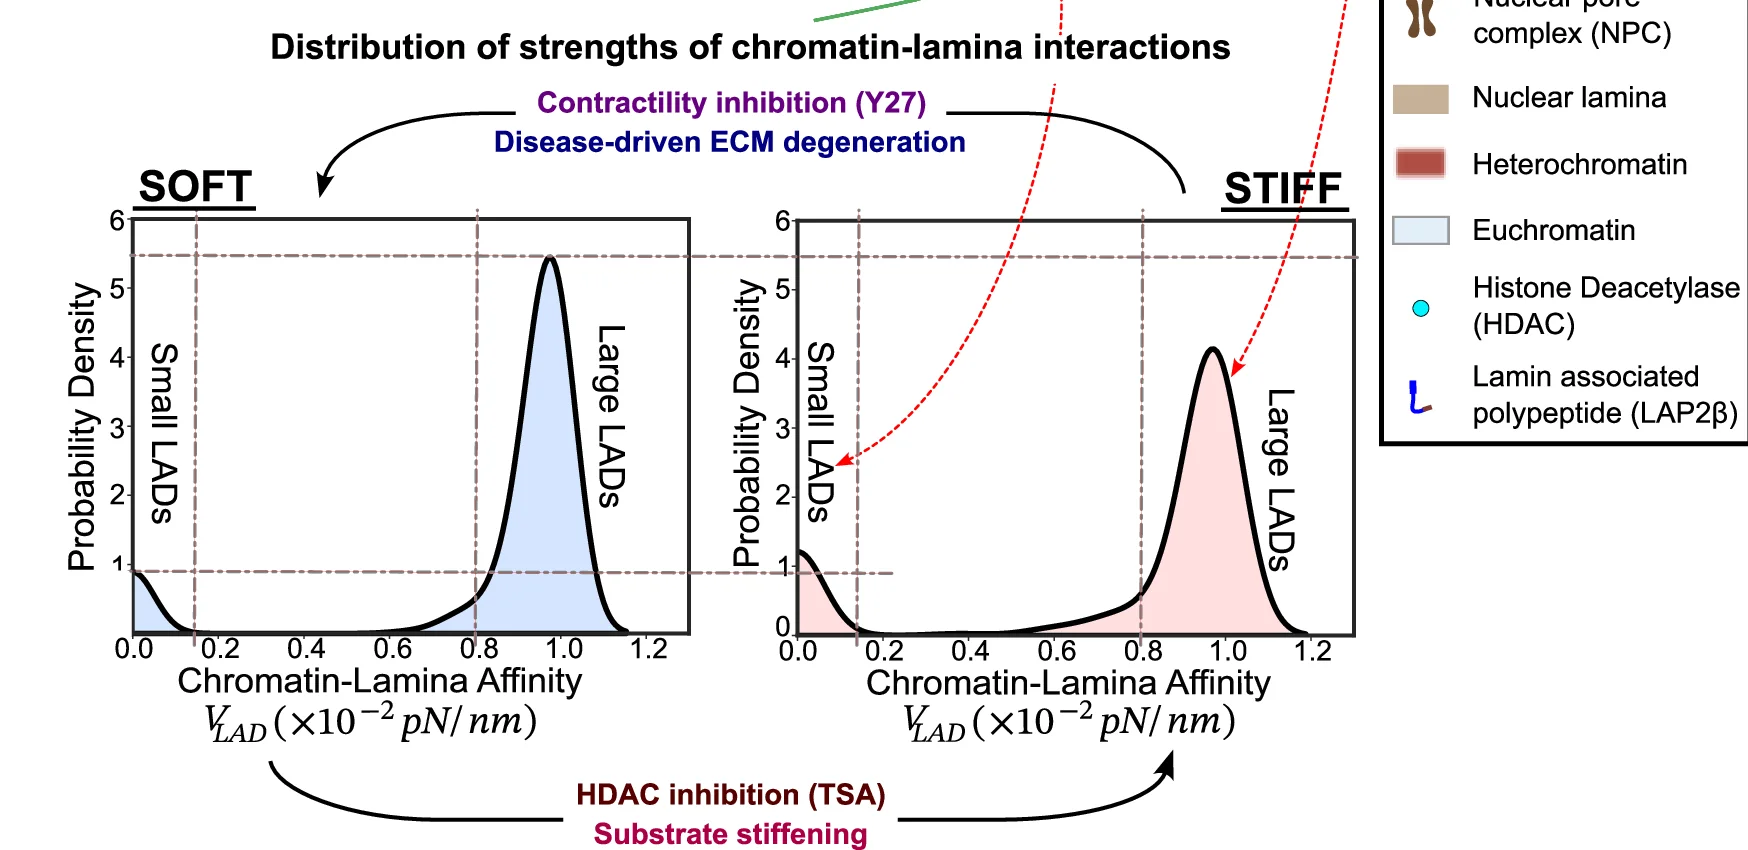
The nucleus-wide distribution of the strength of chromatin-lamina affinity extracted from our framework shows a bimodal distribution with one peak at vanishing chromatin-lamina interactions with small discrete LADs (labelled small LADs) and another at strong chromatin-lamina interactions, comparable to the chromatin-chromatin interactions, with large continuous LADs (labelled large LADs). On a stiff substrate reduced nuclear HDAC3 contributes to decreasing the chromatin-lamina interaction strength. Note that the peak corresponding to large LADs decreases. Also summarizes the effects of pharmacological perturbations (TSA, Y27 treatments), change in substrate stiffness and in-vivo tendinopathic ECM degeneration on the distribution of the chromatin-lamina interaction strengths.
Related Plots
Browse by Category
Popular Collections
Related Tags
Discover More Scientific Plots
Browse thousands of high-quality scientific visualizations from open-access research