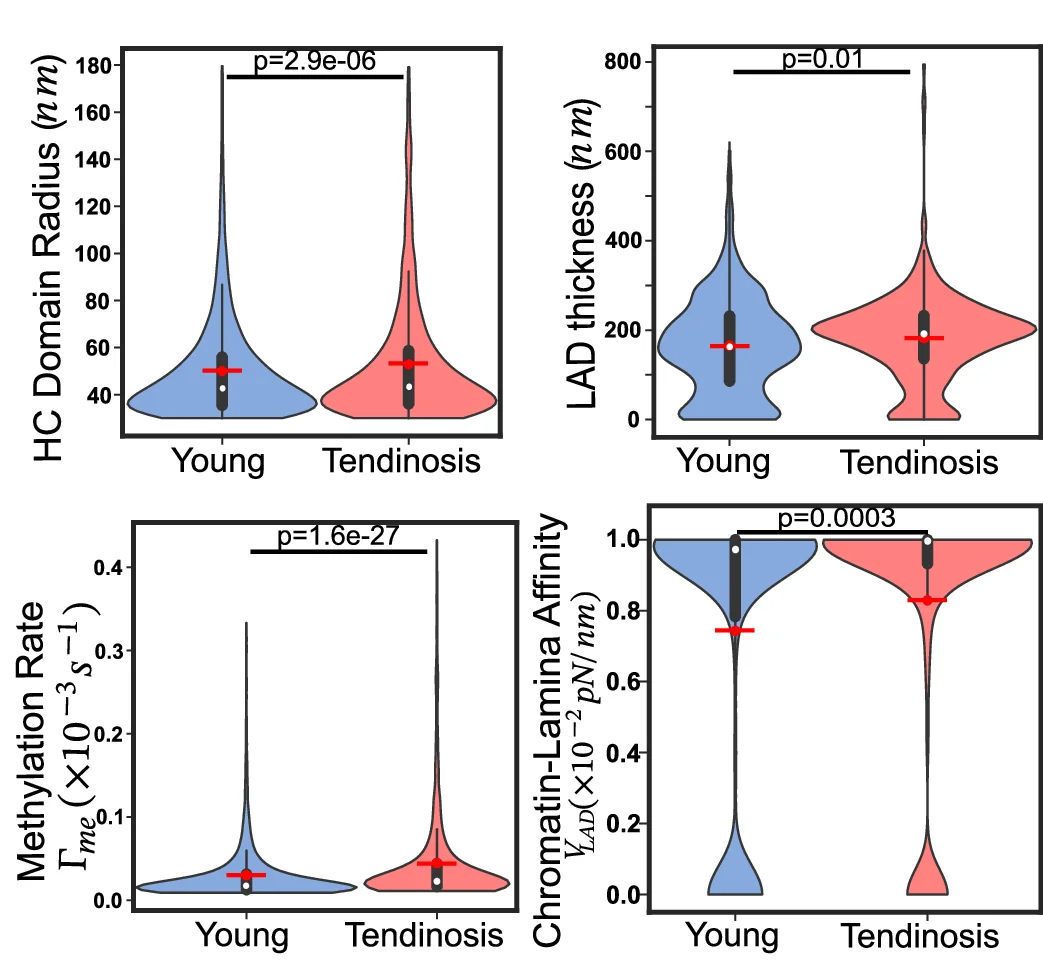
Violin Plot from Scientific Research

CC-BY
29
Views
0
Likes
Citation
Quantitative analysis reveals an increase in the mean heterochromatin domain radius, LAD thickness, methylation rate and chromatin-lamina affinity. (Healthy: n = 14429 loci, 10 nuclei; Diseased: n = 1992, 9 nuclei, unpaired two tail test). All violin plots show a symmetric kernel density estimate (outline), the quartiles (black boxplot), the median (white dot), and the mean (red dot with line).
#Violin Plot#Quantitative Analysis#Heterochromatin Domain Radius#LAD Thickness#Methylation Rate#Chromatin-Lamina Affinity#Violin Plots
Related Plots
Browse by Category
Popular Collections
Discover More Scientific Plots
Browse thousands of high-quality scientific visualizations from open-access research