Violin Plot from Scientific Research

CC-BY
67
Views
0
Likes
Citation
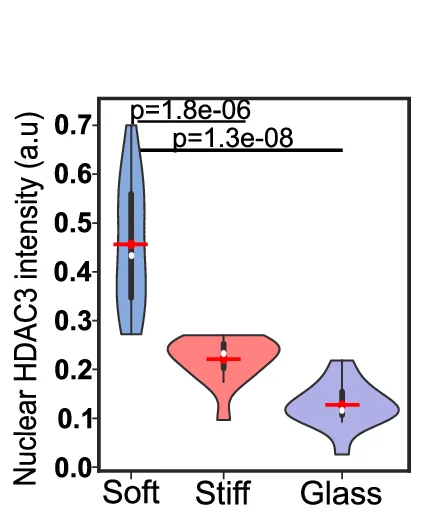
HDAC3 fluorescence intensity quantification, showing decrease in nuclear HDAC3 with increasing substrate stiffness. (Soft: n = 16 nuclei; stiff: n = 15 nuclei; glass: n = 15 nuclei, unpaired two tail test). All violin plots show a symmetric kernel density estimate (outline), the quartiles (black boxplot), the median (white dot), and the mean (red dot with line).
#Violin Plot#HDAC3 Fluorescence Intensity Quantification#Nuclear HDAC3#Substrate Stiffness#Violin Plots#Kernel Density Estimate#Quartiles#Median#Mean
Related Plots
Browse by Category
Popular Collections
Discover More Scientific Plots
Browse thousands of high-quality scientific visualizations from open-access research