Line Plot from Scientific Research

CC-BY
8
Views
0
Likes
Citation
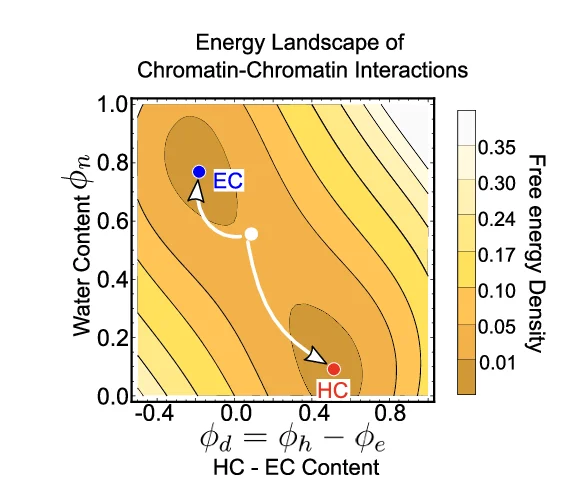
The contour plot of free energy density shows the two wells (local minima) corresponding to the two stable phases of chromatin – euchromatin (blue) and heterochromatin (red). We schematically show how an initial homogeneous distribution of chromatin (white circle) will evolve towards the two energy wells.
#Line Plot#Density Plot#Free Energy Density#Contour Plot#Euchromatin#Heterochromatin#Chromatin Distribution
Related Plots
Browse by Category
Popular Collections
Related Tags
Discover More Scientific Plots
Browse thousands of high-quality scientific visualizations from open-access research