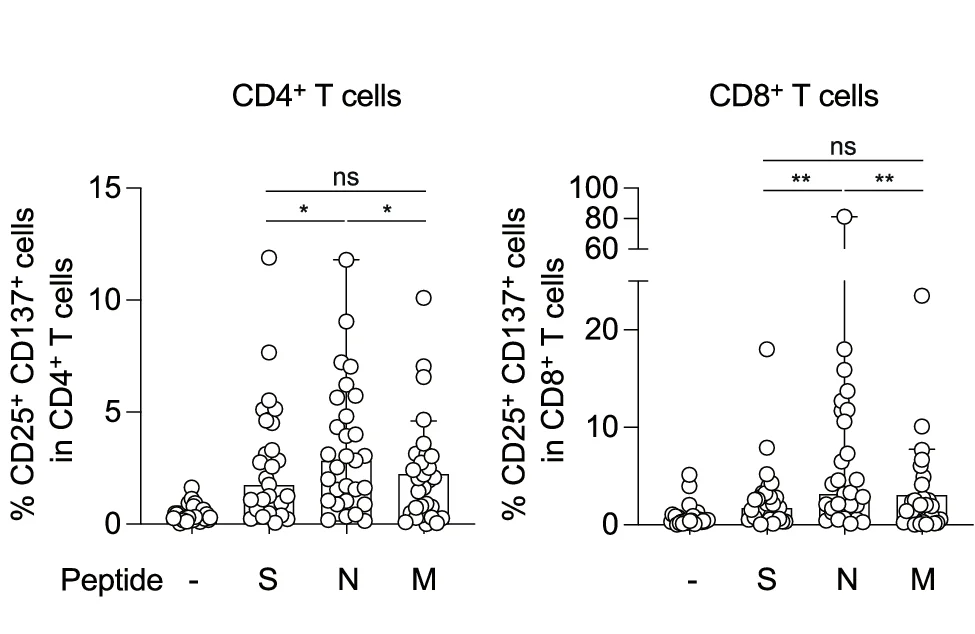
Scatter Plot from Scientific Research

Citation
The median percentages of CD25 + CD137 + CD4 + or CD8 + T cells in convalescent donors ( n = 29), and statistically significant differences in CD25 + CD137 + CD4 + T cells after stimulation with the N pools between the indicated peptides (* p = 0.0474 and * p = 0.025; versus S and M pools, respectively) and in CD25 + CD137 + CD8 + T cells after stimulation with the N pools between the indicated peptides (** p = 0.0014 and ** p = 0.0017; versus S and M pools, respectively) are determined by a two-tailed Wilcoxon matched-pairs signed-rank test. ns, no statistical significance. Data are expressed as median. See also Supplementary Fig. 1a (Gating strategy). See also Table 1 (donor information).
Related Plots
Browse by Category
Popular Collections
Discover More Scientific Plots
Browse thousands of high-quality scientific visualizations from open-access research