Scatter Plot from Scientific Research

CC-BY
43
Views
0
Likes
Citation
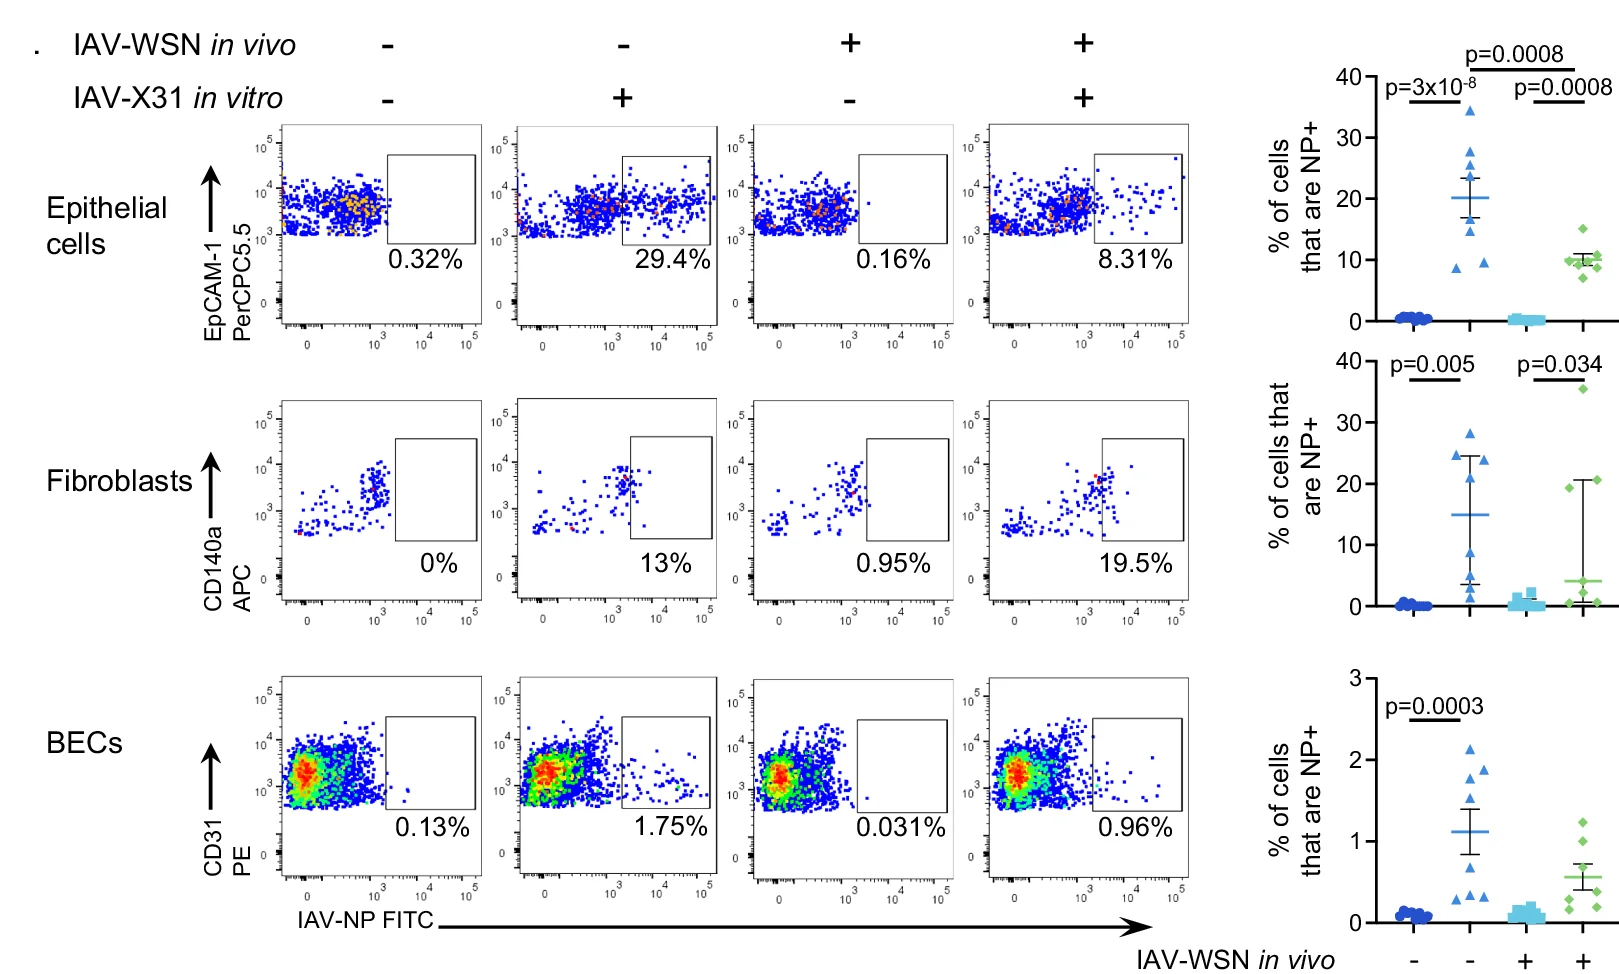
Representative FACS plots and data for IAV-Nucleoprotein (NP) for each cell type, graphed data are the average of two technical replicates per mouse. Cells were gated on live, single, CD45-negative EpCAM1+ (epithelial cells), CD140+ (fibroblasts), and CD31+ (blood endothelial cells). Numbers in plots indicate the percentages of cells that are IAV-NP +.
#Scatter Plot#Error Bars#FACS Plots#Influenza A Virus Nucleoprotein#Epithelial Cells#Fibroblasts#Blood Endothelial Cells#CD45 Negative Cells
Related Plots
Browse by Category
Popular Collections
Discover More Scientific Plots
Browse thousands of high-quality scientific visualizations from open-access research