Violin Plot from Scientific Research

CC-BY
8
Views
1
Likes
Citation
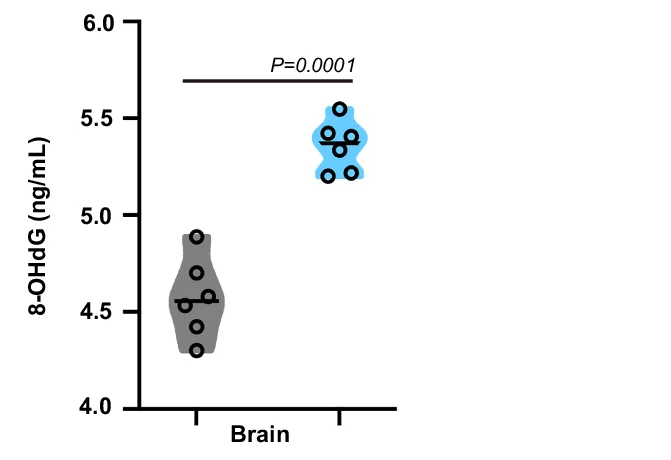
ELISA of basal levels of 8-hydroxydeoxyguanosine (8-OHdG) in the brain of iCab and CPD KO medaka. Violin plots represent individual data points (n = 6 biologically independent samples with each sample including 9 fish) shown as black hollow circles and their probable distribution. The horizontal black lines within the violin plots represent mean values of 8-OHdG. The statistical test used is student’s t-test. Statistical differences (P values) are annotated in each panel. Source data are provided as a Source Data file.
Related Plots
Browse by Category
Popular Collections
Related Tags
Discover More Scientific Plots
Browse thousands of high-quality scientific visualizations from open-access research