Line Plot from Scientific Research

CC-BY
3
Views
0
Likes
Citation
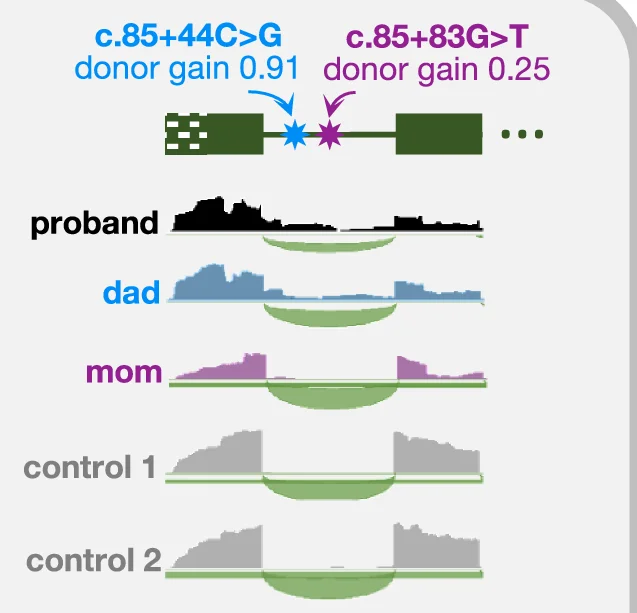
RNA-Seq reads from whole blood samples aligned to first two exons and first intron of MED11 for proband (black), dad (blue), mom (purple) and two tissue-matched control samples (gray). Thin green line represents the intron, solid boxes represent protein-coding exonic regions, and the dotted box represents the 5’ untranslated region of MED11 .
#Line Plot#Density Plot#RNA-Seq Reads#Whole Blood Samples#Exons#Intron#MED11#Proband#Control Samples#Protein-Coding Exonic Regions#5’ Untranslated Region
Related Plots
Browse by Category
Popular Collections
Related Tags
Discover More Scientific Plots
Browse thousands of high-quality scientific visualizations from open-access research