Line Plot from Scientific Research

CC-BY
9
Views
0
Likes
Citation
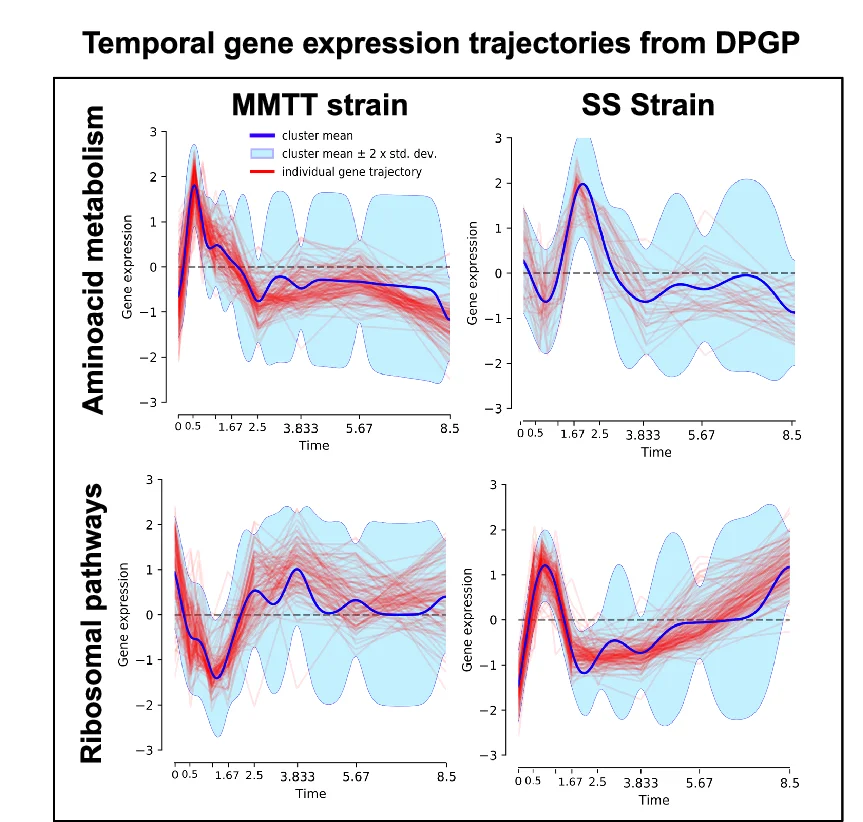
Temporal gene expression trajectories of genes involved in amino acid metabolism and ribosomal pathways, derived from DPGP clustering. Shaded regions represent 2 standard deviations (SD) around the mean expression trajectory.
#Line Plot#Error Bars#Temporal Gene Expression#Amino Acid Metabolism#Ribosomal Pathways#DPGP Clustering#Standard Deviations#Mean Expression Trajectory
Related Plots
Browse by Category
Popular Collections
Discover More Scientific Plots
Browse thousands of high-quality scientific visualizations from open-access research