Scatter Plot from Scientific Research

CC-BY
6
Views
0
Likes
Citation
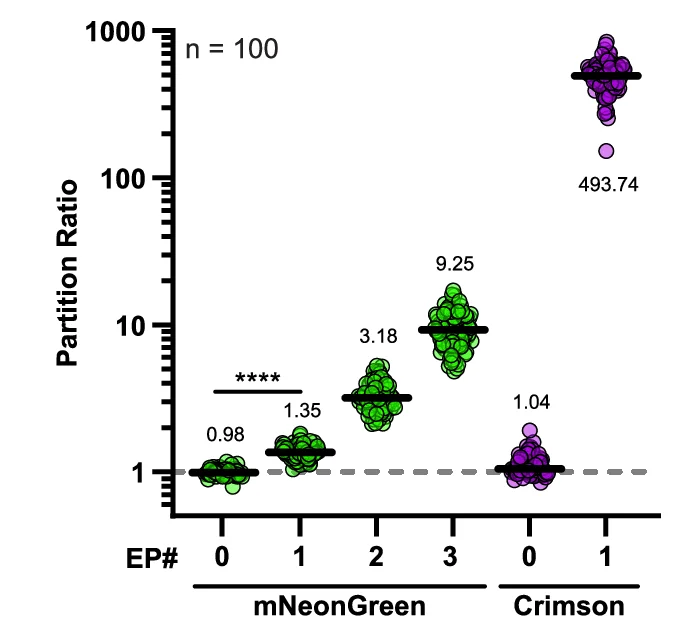
Partitioning was calculated by the quotient of background subtracted foci signal over non-foci signal. This analysis confirmed that partitioning increases with additional EP domains and that emergent valency outcompetes intrinsic in all cases. Medians are denoted within each sample with the black bar. **** denotes p < 0.0001 given by an upaired t -test.
#Scatter Plot#Error Bars#Partitioning#Foci signal#EP domains#Emergent valency#Intrinsic valency#T-test
Related Plots
Browse by Category
Popular Collections
Related Tags
Discover More Scientific Plots
Browse thousands of high-quality scientific visualizations from open-access research