Box Plot from Scientific Research

Citation
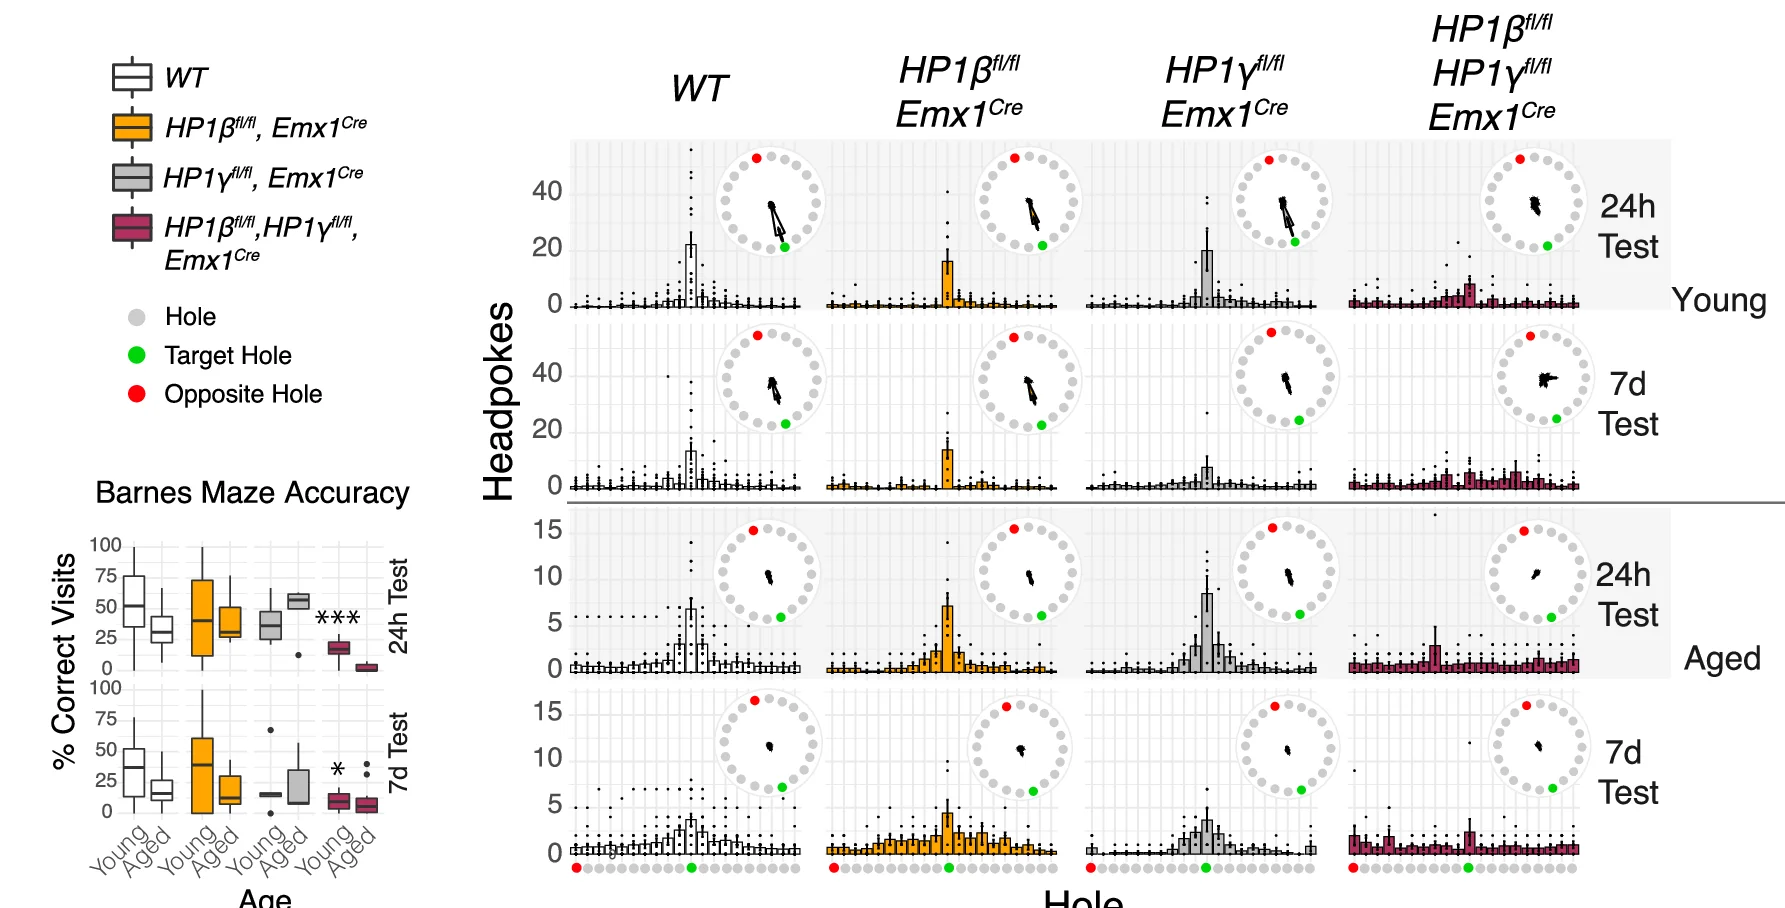
Histograms of performance in the circular Barnes Maze (mean count ± SEM & raw data points, green = target hole, red = opposite). Histograms plot mean headpokes ±SEM. of n WT(young) = 18, n WT(aged) = 16, n HP1βKO(young) = 11, n HP1 β KO(aged) = 7, n HP1γKO(young) = 6, n HP1γKO (aged) = 5, n HP1β/γ DKO (young) = 11, n HP1β/γ DKO (young) = 12. Two way ANOVA, Bonferroni adjustment on multiple comparison, two-tailed. HP1β/γ DKO young vs WT young 24 h test p = 0.0009. HP1β/γ DKO young vs WT young 24 h test p = 0.0081. Box and whisker plots ( a , b ) display median, bounds of box at 25 th and 75 th percentiles, and whiskers to farthest datapoint within 1.5 * the interquartile range. All raw data can be seen in the Source Data file.
Related Plots
Browse by Category
Popular Collections
Related Tags
Discover More Scientific Plots
Browse thousands of high-quality scientific visualizations from open-access research