Line Plot from Scientific Research

CC-BY
9
Views
0
Likes
Citation
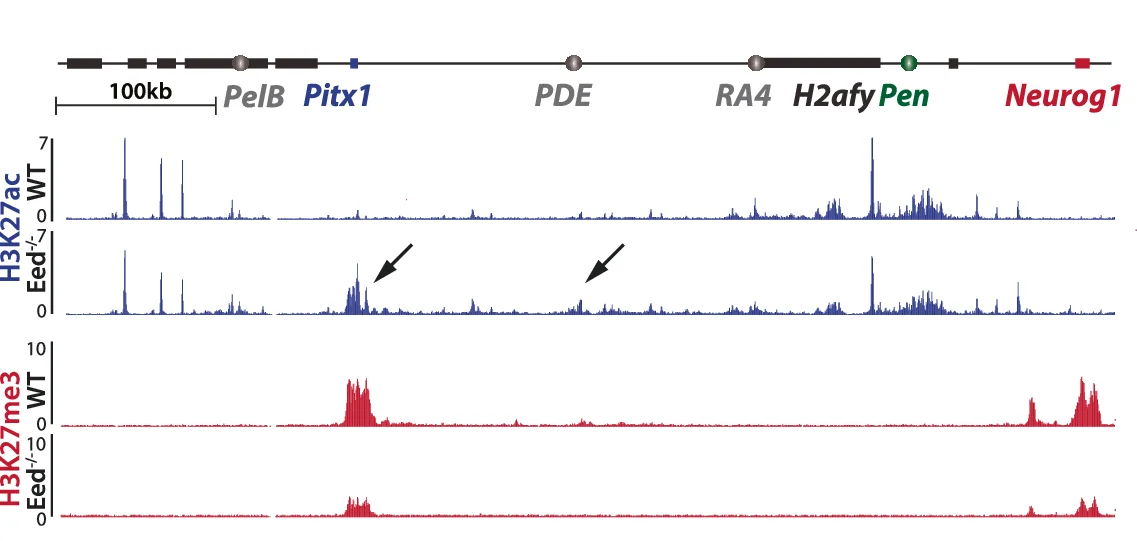
ChIP-seq of H3K27ac (first two tracks) and H3K27me3 (two last tracks) show an accumulation of H3K27ac at the Pitx1 locus (black arrows) in proximal Prx1-Cre;Eed flox/- ( Eed -/- ) compared to wildtype (WT) forelimbs and an overall reduction of H3K27me3 signal.
Related Plots
Browse by Category
Popular Collections
Related Tags
Discover More Scientific Plots
Browse thousands of high-quality scientific visualizations from open-access research