Scatter Plot from Scientific Research

CC-BY
8
Views
0
Likes
Citation
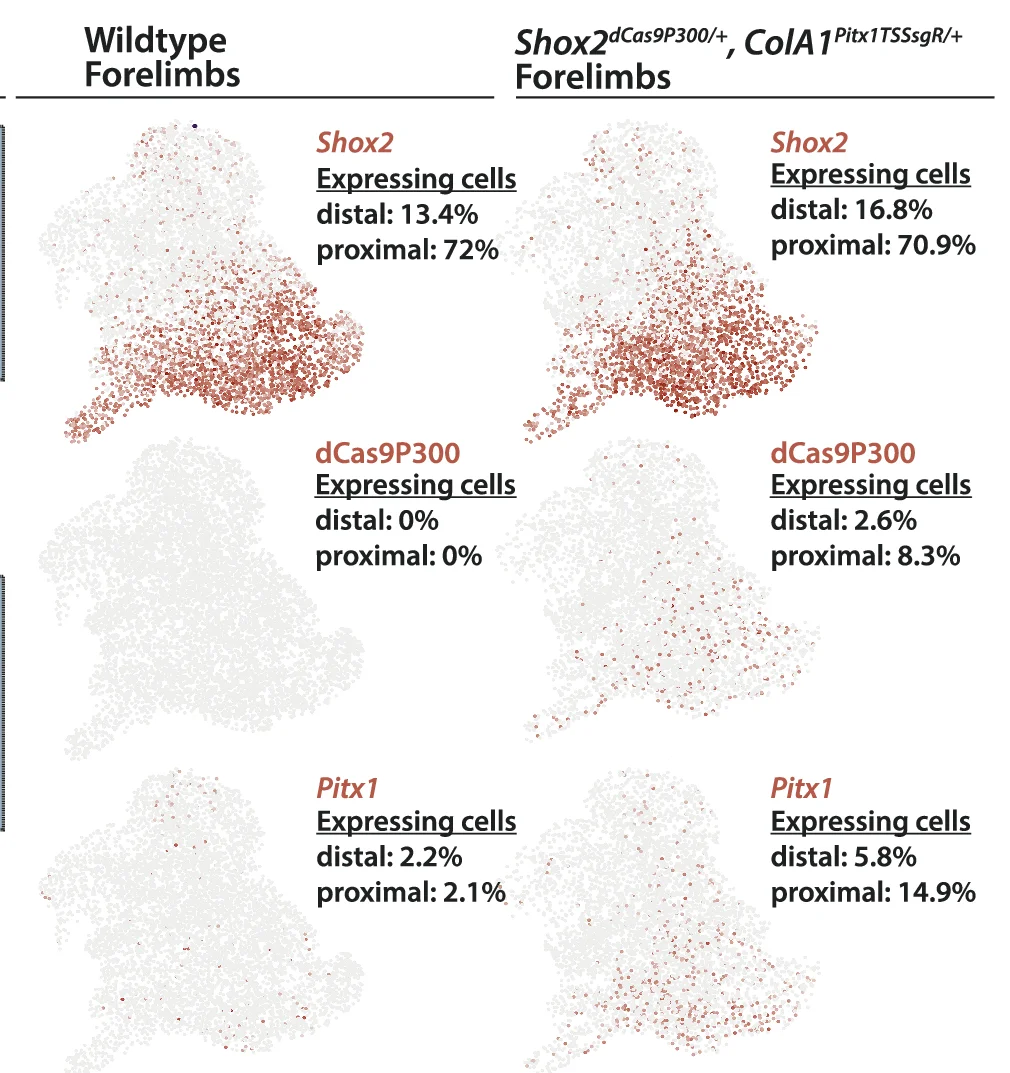
Individual UMAPS of scRNA-seq data from wildtype and Shox2 dCas9P300/+ ;ColA1 TSSsgR/+ forelimbs showing the distribution of Shox2 , Pitx1 and dCas9P300 expressing cells as well as the respective percentage of expressing cells in proximal forelimb (proximal) and distal forelimb (distal).
#Scatter Plot#UMAPS#scRNA-seq#Wildtype#Shox2 dCas9P300#ColA1 TSSsgR#Forelimbs#Shox2#Pitx1#dCas9P300#Proximal forelimb#Distal forelimb
Related Plots
Browse by Category
Popular Collections
Discover More Scientific Plots
Browse thousands of high-quality scientific visualizations from open-access research