Line Plot from Scientific Research

CC-BY
5
Views
0
Likes
Citation
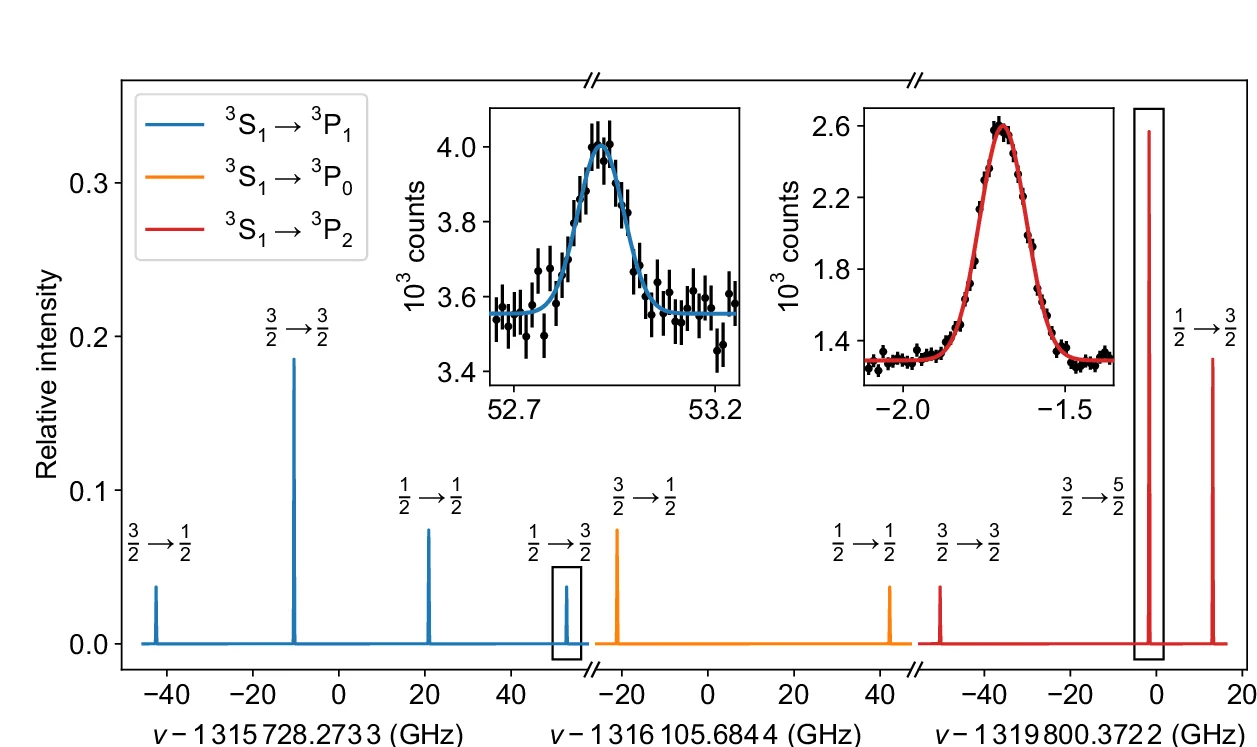
Hyperfine-structure (HFS) spectrum of the 1 s 2 s 3 S 1 (to) 1 s 2 p 3 P 0,1,2 transitions in 13 C 4+ simulated with the experimentally determined frequencies and linewidths. The x -axis represents the laser frequency in the rest-frame of the ion ν relative to the center-of-gravity frequency of the respective fine-structure transition. The peak heights were set to the theoretical transition strengths used in Eq. ( 7 ). The two insets show measured spectra of the marked transitions. Next to the resonances, the contributing quantum numbers Fto {F}^{{\prime} } of the lower and upper states are shown, respectively.
#Line Plot#Scatter Plot#Error Bars#Hyperfine Structure#Spectrum#Carbon Ions#Laser Frequency#Fine Structure Transition
Related Plots
Browse by Category
Popular Collections
Related Tags
Discover More Scientific Plots
Browse thousands of high-quality scientific visualizations from open-access research