Line Plot from Scientific Research

CC-BY
2
Views
0
Likes
Citation
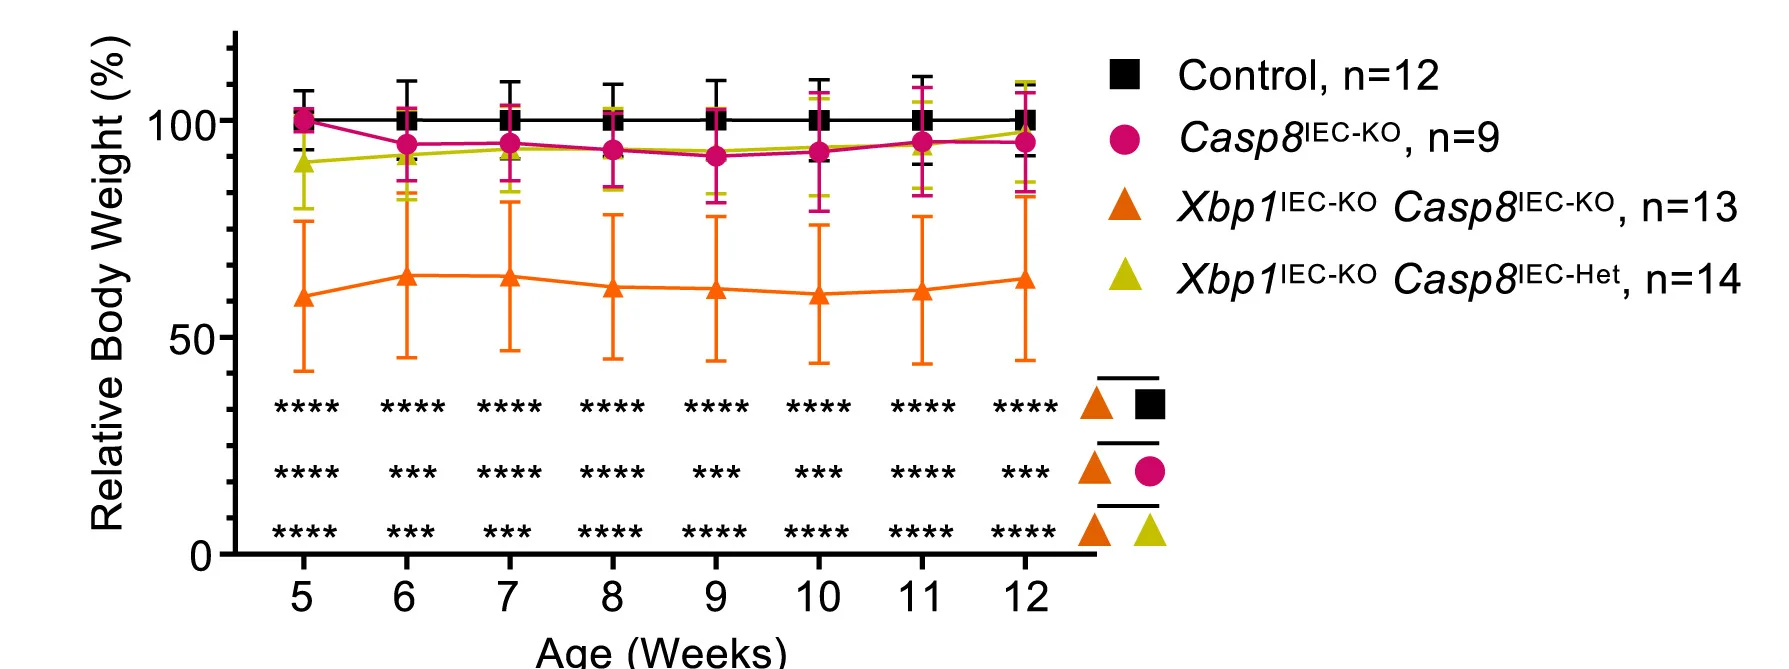
Graph depicting the relative body weight of mice with the indicated genotypes compared with their littermate controls between 5 and 12 weeks of age. Graph shows mean ± SEM. p values were calculated by two-way ANOVA. ***p< 0.005, ****p< 0.0001.
Related Plots
Browse by Category
Popular Collections
Related Tags
Discover More Scientific Plots
Browse thousands of high-quality scientific visualizations from open-access research