Bubble Plot from Scientific Research

CC-BY
4
Views
0
Likes
Citation
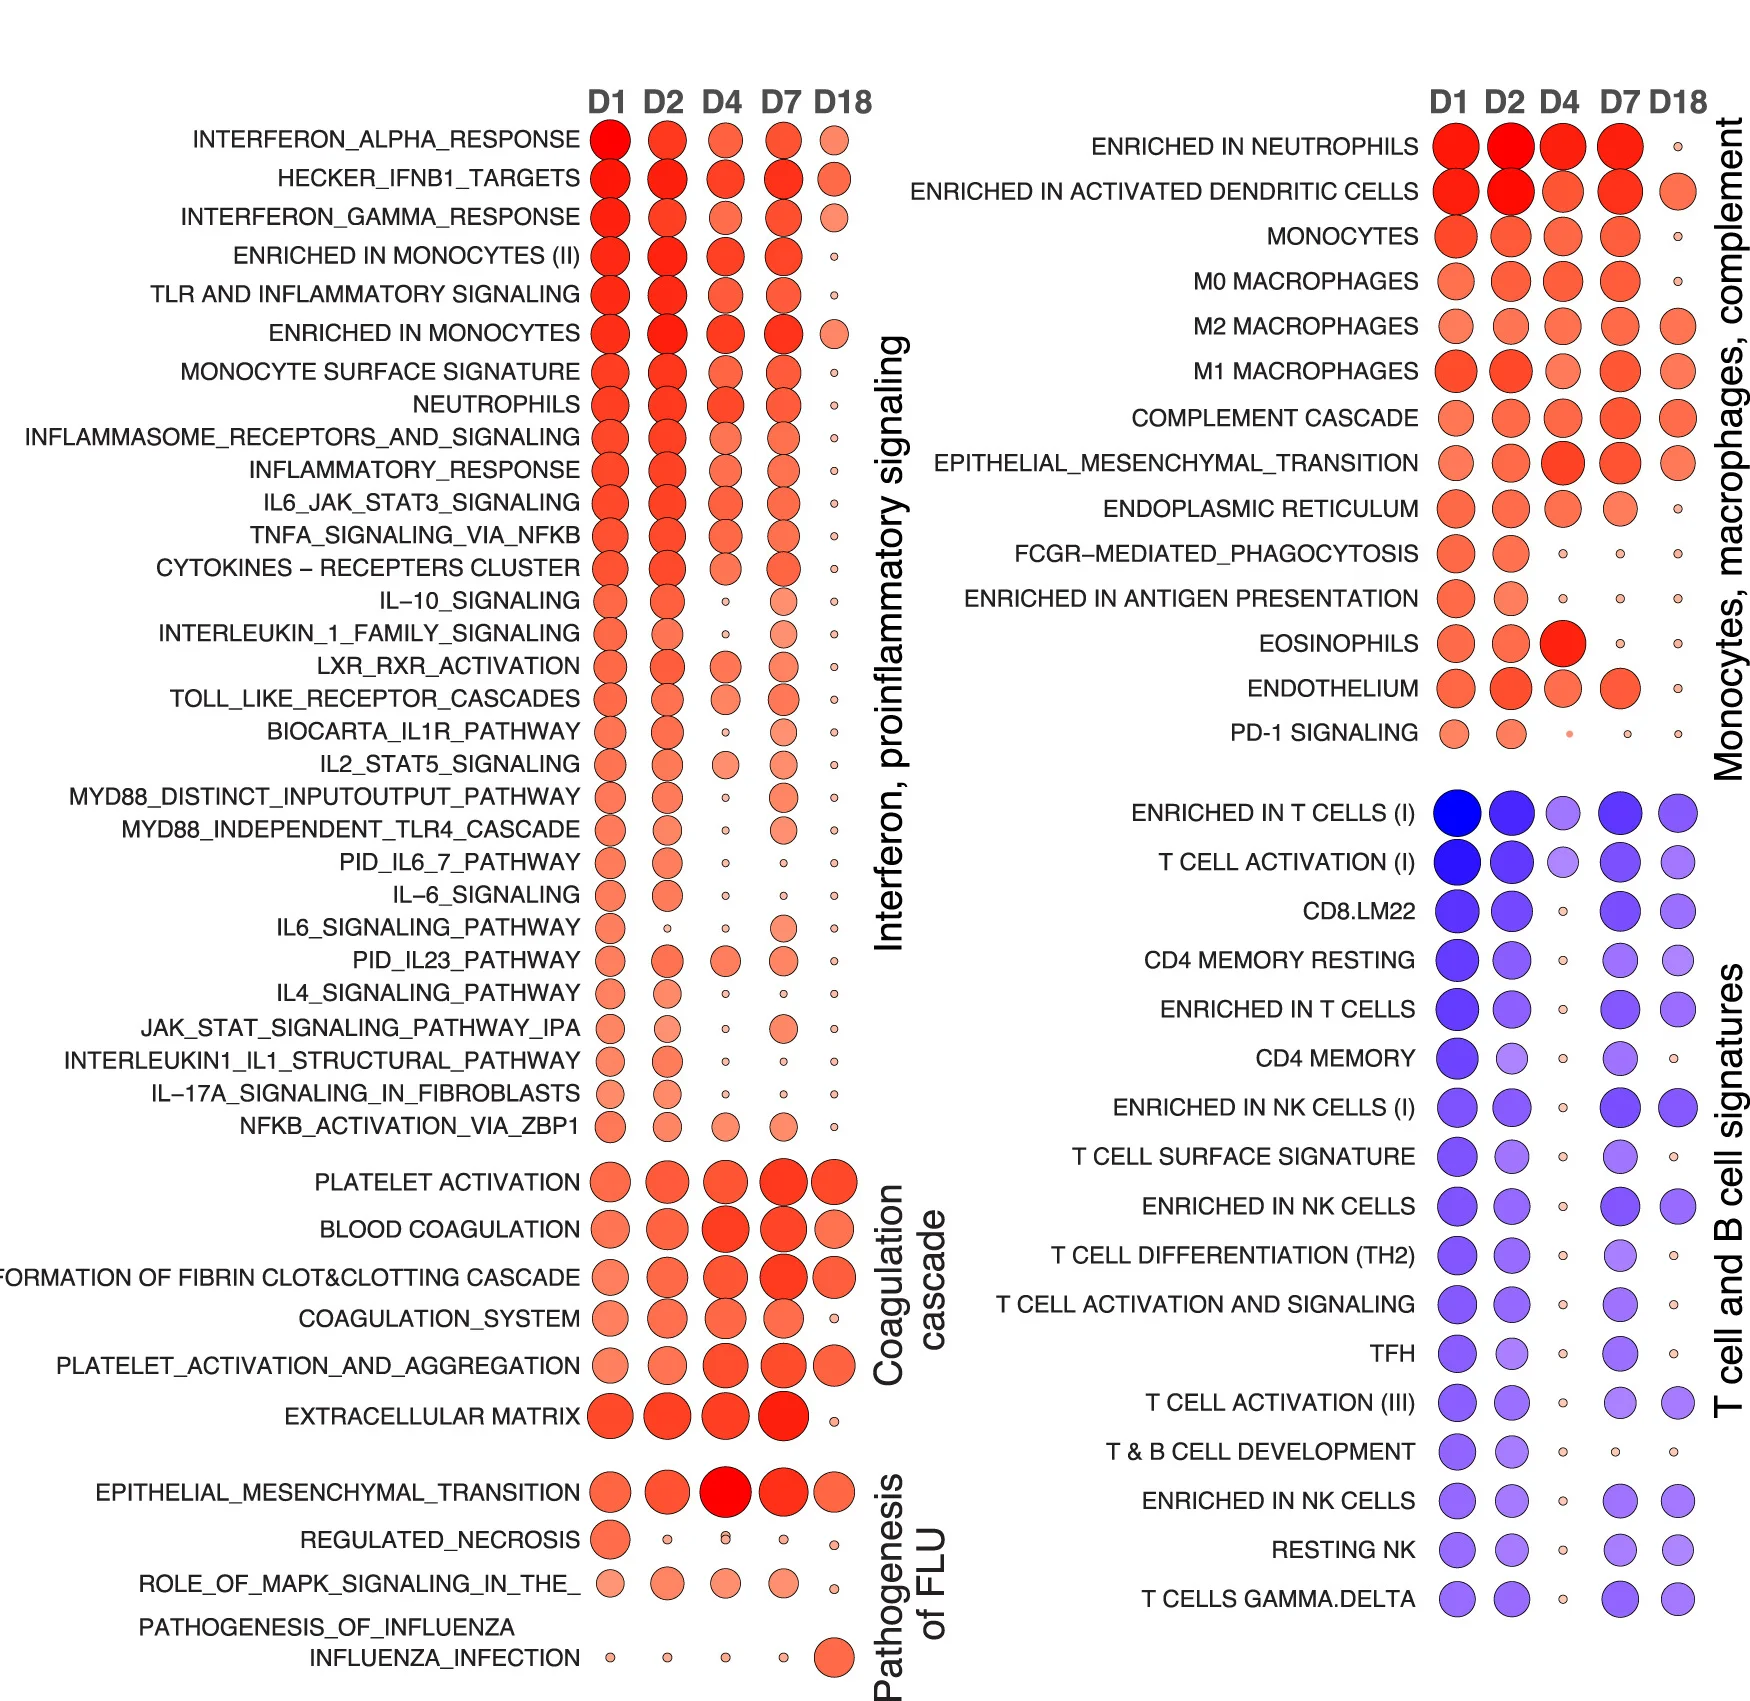
Transcriptomic profiling of rhesus macaques on days 1, 2, 4, or 7 and study termination (necropsy or day 18). Circle plots show gene signatures on various days following challenge as compared with baseline. Circle size refers to the level of the enrichment, and the color reflects if the pathway is enriched (red gradient) or reduced (blue gradient). All pathways were significant with a nominal p value of <0.05.
Related Plots
Browse by Category
Popular Collections
Discover More Scientific Plots
Browse thousands of high-quality scientific visualizations from open-access research