Box Plot from Scientific Research

CC-BY
86
Views
0
Likes
Citation
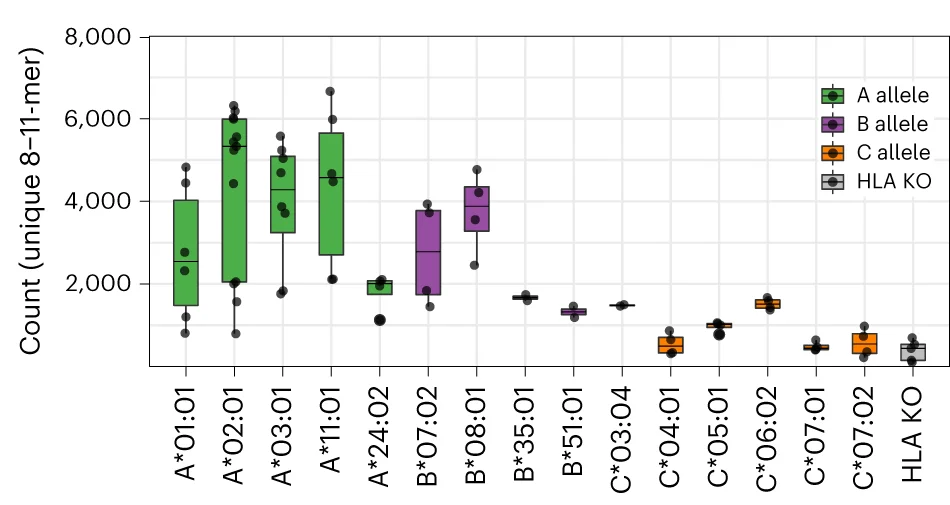
Number of unique 8–11-mer peptides identified in untargeted immunopeptidomic analysis. The box represents the interquartile range; the line represents the median value; and the whiskers represent the minimum and maximum values (excluding outliers). Each dot represents a separate analysis beginning with a replicate cell pellet (A*01:01 n = 6, A*02:01 n = 13, A*03:01 n = 8, A*11:01 n = 6, A*24:02 n = 4, B*07:02 n = 4, B*08:01 n = 4, B*35:01 n = 2, B*51:01 n = 2, C*03:04 n = 2, C*04:01 n = 4, C*05:01 n = 4, C*06:02 n = 4, C*07:01 n = 4, C*07:02 n = 4, HLAKO n = 5).
Related Plots
Browse by Category
Popular Collections
Related Tags
Discover More Scientific Plots
Browse thousands of high-quality scientific visualizations from open-access research