Bar Plot from Scientific Research

CC-BY
46
Views
0
Likes
Citation
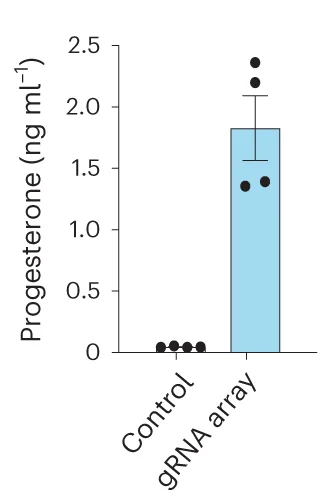
Secreted progesterone levels after mini-DREAM-transduced HEK293T cells were transfected with the indicated gRNA array or a nontargeting gRNA control plasmid. All samples were processed for qPCR or ELISA at 72 h post-transfection. Data are the result of 4 biological replicates for b , c , e , f , j , m and n , and 3 or 4 biological replicates for h . See the source data for more information. Data are presented as mean s.e.m. P values were determined using unpaired two-sided t -test. BH, bridge helix; eN, engineered NRF2; M, MRTF-A; PI, PAM-interacting domain; REC, recognition lobe; S, STAT1.
#Bar Plot#Error Bars#Scatter Plot#Progesterone Levels#Mini-DREAM-transduced HEK293T Cells#gRNA Array#Nontargeting gRNA Control Plasmid#qPCR#ELISA
Related Plots
Browse by Category
Popular Collections
Related Tags
Discover More Scientific Plots
Browse thousands of high-quality scientific visualizations from open-access research