Line Plot from Scientific Research

CC-BY
122
Views
0
Likes
Citation
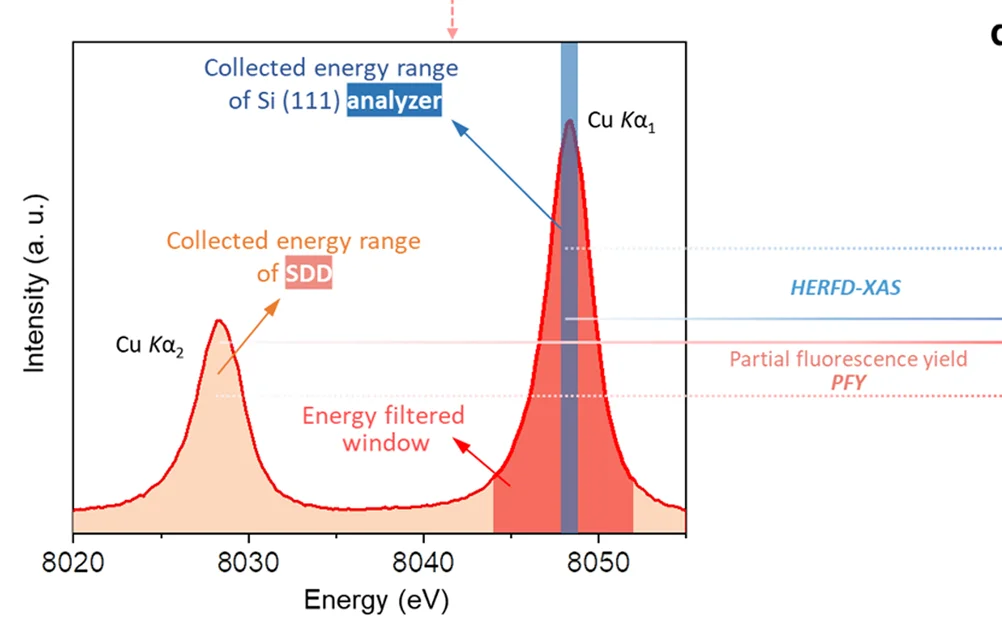
Spectra correspond to the analysis of a Cu foil with a silicon-drift detector (PFY, orange highlight; Energy-filtered window, red highlight) and a crystal analyzer using Si (111) (HERFD-XAS, blue highlight).
Related Plots
Browse by Category
Popular Collections
Related Tags
Discover More Scientific Plots
Browse thousands of high-quality scientific visualizations from open-access research