Scatter Plot from Scientific Research

CC-BY
135
Views
1
Likes
Citation
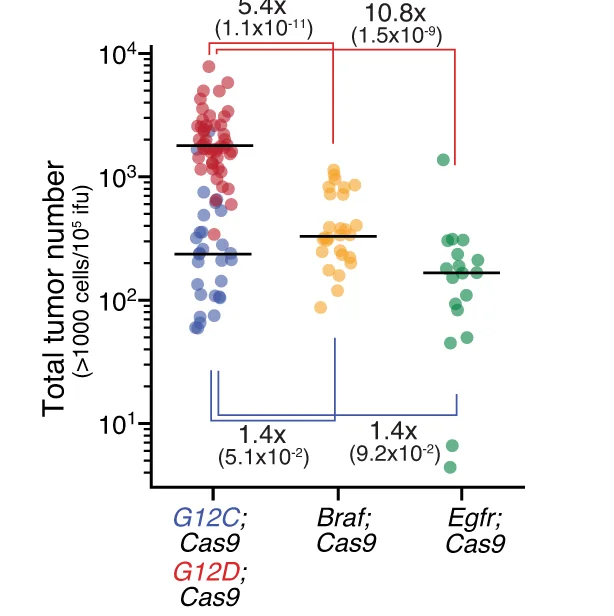
Total number of tumors greater than 1000 cells in size ( E ) across all Lenti-sgRNA/Cre vectors, normalized to viral titer. Mouse genotypes are indicated. Each dot represents a mouse, and the bar is the median. Fold differences between medians and significance calculated using a two-sided Wilcoxon rank-sum test ( P values = number in parentheses) are shown. Fold differences are ratios of the following pairs, moving clockwise from the upper left: G12D;Cas9/Braf;Cas9, G12D;Cas9/Egfr;Cas9, G12C;Cas9/Egfr;Cas9, Braf;Cas9/G12C;Cas9 .
Related Plots
Browse by Category
Popular Collections
Related Tags
Discover More Scientific Plots
Browse thousands of high-quality scientific visualizations from open-access research