Scatter Plot from Scientific Research

CC-BY
45
Views
1
Likes
Citation
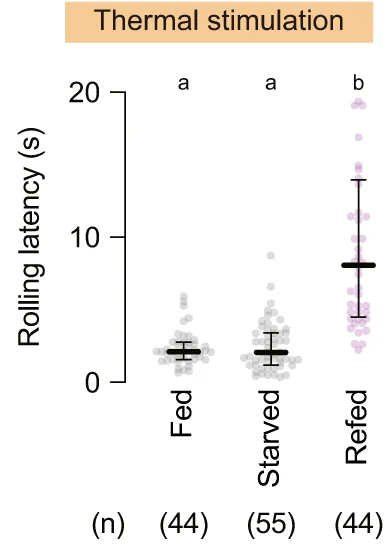
Thermo-nociceptive responses of larvae after normal feeding, starvation, or starvation followed by refeeding with sucrose. In this and following panels, 'n' indicates the number of biologically independent animals used for each group, and the thick line and the thin error bar represent the median and the interquartile range, respectively. a, b p < 0.0001 (Kruskal-Wallis one-way ANOVA).
#Scatter Plot#Error Bars#Thermo-nociception#Larvae#Feeding#Starvation#Refeeding#Sucrose#Kruskal-Wallis one-way ANOVA
Related Plots
Browse by Category
Popular Collections
Related Tags
Discover More Scientific Plots
Browse thousands of high-quality scientific visualizations from open-access research