Bar Plot from Scientific Research

CC-BY
57
Views
0
Likes
Citation
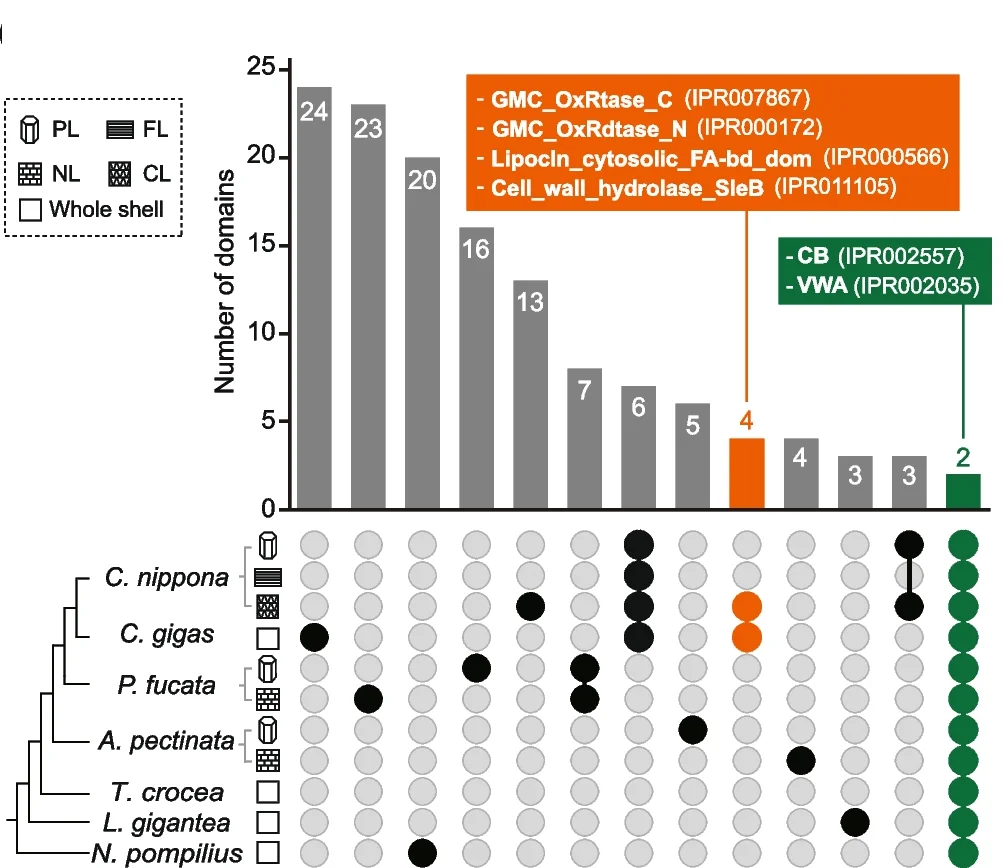
Upset plot comparing the protein domains identified from the shell proteomes of seven molluscs. The bar chart indicates the number of functional domains conserved among shell microstructure(s) or the whole shell of specie(s). The colored dots below histograms indicate the presence of the domains in shells of the molluscs. Domains only detected in the C. gigas shell and the chalky layer of C. nippona shell are indicated in orange. Domains shared by all shell layers across seven molluscs are colored in green. The complete results are shown in supplementary figure S11 (Additional file 1 ).
#Bar Plot#Upset Plot#Protein Domains#Shell Proteomes#Molluscs#Shell Microstructure#C. gigas#Chalky Layer#C. nippona
Related Plots
Browse by Category
Popular Collections
Related Tags
Discover More Scientific Plots
Browse thousands of high-quality scientific visualizations from open-access research