Scatter Plot from Scientific Research

CC-BY
77
Views
0
Likes
Citation
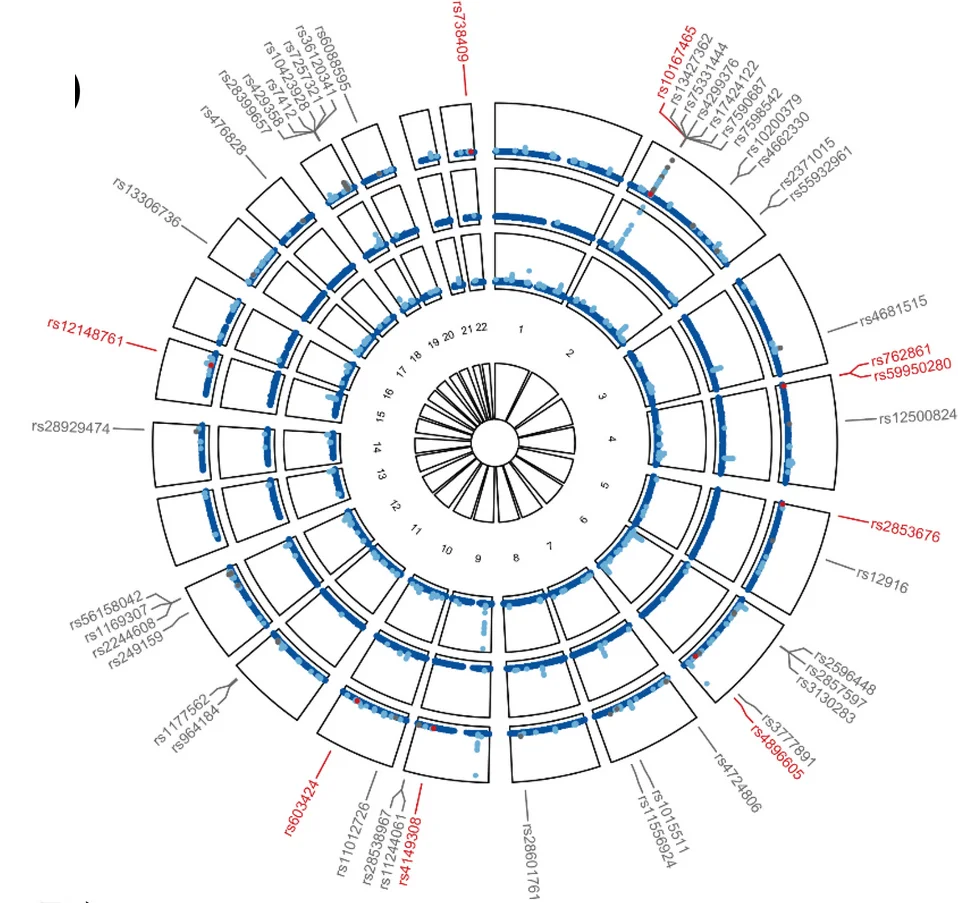
In each circular Manhattan plot, the outermost circle shows the cross-trait meta-analysis results between gallstone disease and coronary artery disease; from the periphery to the center, each circle shows the GWAS results on gallstone disease and cardiovascular diseases, respectively. Light blue indicates variants with genome-wide significance (P < 5 x 10 –8) while dark blue indicates variants with P ≥ 5 x 10 –8. According to their single-trait and cross-trait characteristics, SNPs are divided into two different types named “Known associated SNP” and “Novel shared SNP”,which are presented in grey and red, respectively. RSIDs of them are listed.
#Scatter Plot#Manhattan Plot#Gallstone Disease#Coronary Artery Disease#GWAS#Cardiovascular Diseases#Meta-analysis#SNPs
Related Plots
Browse by Category
Popular Collections
Discover More Scientific Plots
Browse thousands of high-quality scientific visualizations from open-access research